Travel Maps
Data Visualization Design
Being a designer with a fascination in visualizing and contextualizing our world, I’ve taken on a few projects that endeavor to bring a more humanizing approach to personalized data visualization. Often, data visualizations have a tendency to look cold, unapproachable or simply visually uninspired. By mapping out raw data, it’s often required to take a more mainstream approach to maximize comprehension. My approach to data visualization allows the data to inspire me into creating something more subtle. By mixing this inspired approach with artistic sensibilities, I tend to establish a more unique set of rules by which the data maps to.
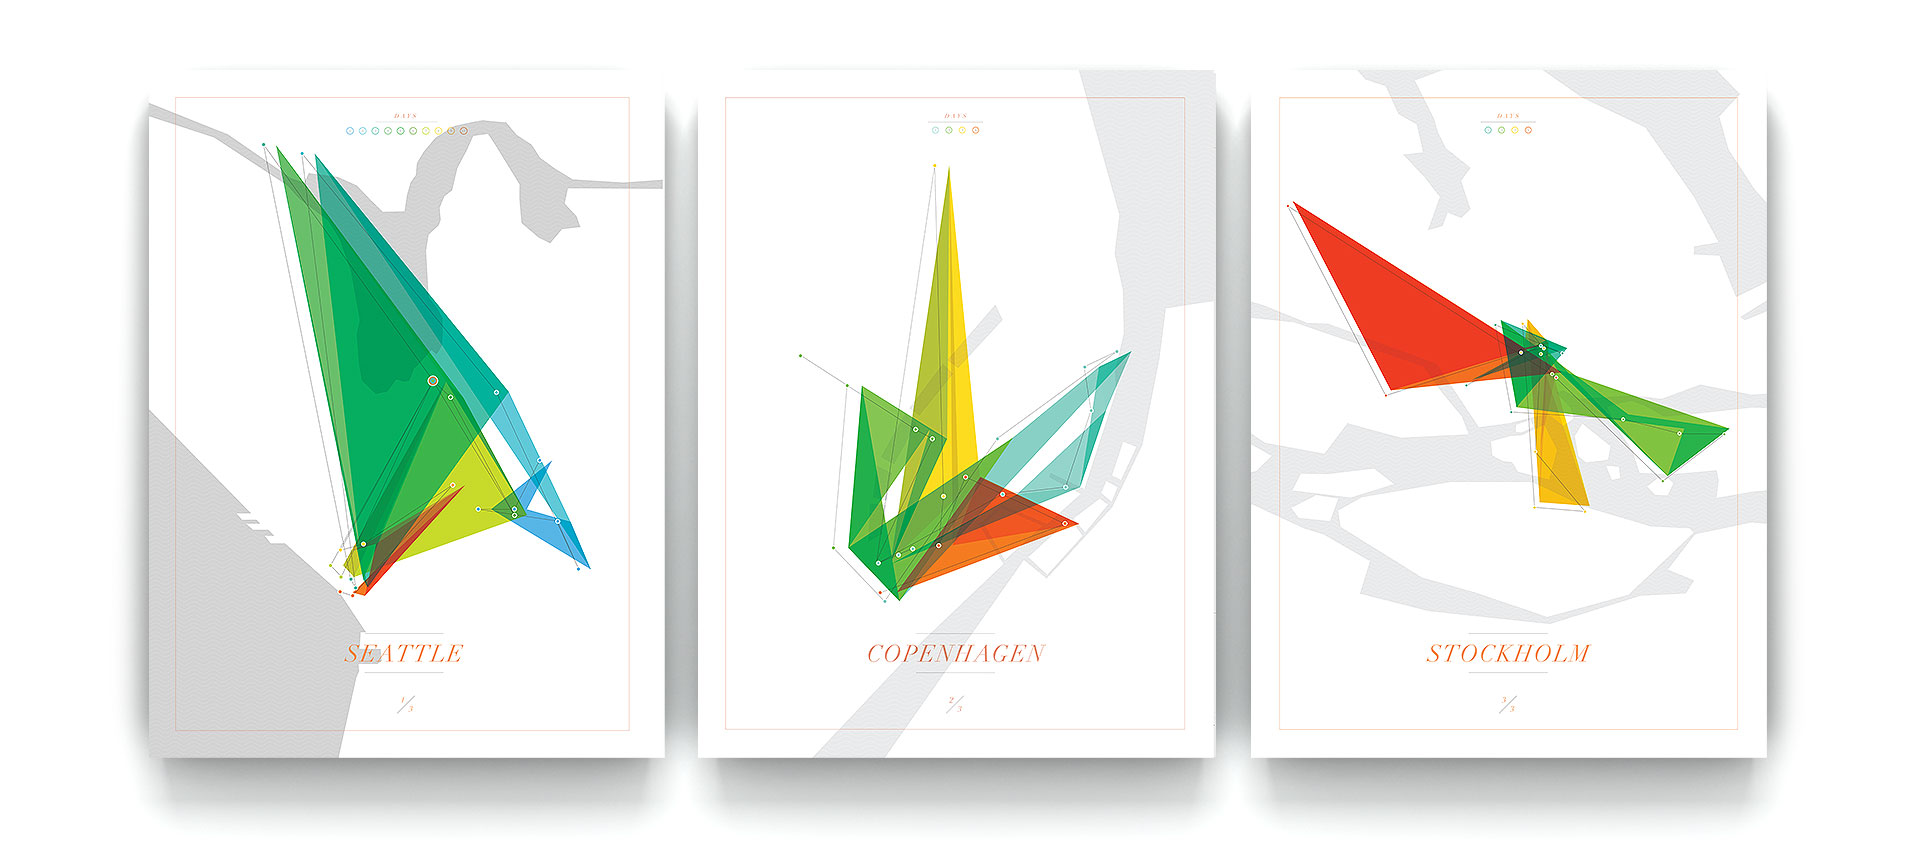
In the case of these maps, the approach was simple. Inspired by the abstract generative work of manfred mohr and the look of abstract stained glass designs, I sought to develop a language of GPS triangulation based on locations I had visited. I wanted to create personal pieces of artwork that had a meaning to them and a history. By using my locations from trips and coloring the triangulated fields based on the day, I created a designed system of abstract graphics that symbolise an artistic approach to visualizing data that can be interpreted simply on their visuals or explored for a deeper. An approach I employ on all graphic design projects.
This is an ongoing experiment designed to be built into an interactive site that allows anyone to make their own designs based on trips they’ve been on. Until that site is launched and thousands of these designs are generated every day, this processes of exploration and refinement will continue.
